I've been playing with temp test lately and this one is up next!
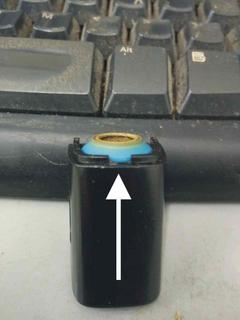
Here's my temp placement. The silicone gasket made it easy to install without messing up the screen. This felt to me like it was in the lower half of the bowl near the center of the load of abv.
First graph is a sit test. I didn't make note of the probe temp when the Fury 2 got to 390, and I should have. My money is on 200F, though, since it looks like it on the graph and that's what it did in the usage test later on. Anyhow, here it is:
The unit ramped up to 200 in the bowl quickly while the heater got to 390, at which point it stabilized for a little bit before a steady climb up to about 330F in the bowl, I assume due to radiant heat. It stabilized here, more or less, for the last 90ish seconds of the session before shutting off. It took about two and a half minutes to cool down to 200F.
Here's the actual session test in real world settings with a bowl of herb set to 390. It was a casual session with four hits. Here's the chart:
- Again, the unit got to 200F in the bowl when it registered 390 on the display, so I hit it like normal.
- The temp shot up to 370 over the duration of my strong 15 second draw, at which point it started slowly dropping down to 340 when I started my second hit.
- The second hit started out slowly to see how it would react, and the two bumps at the top are where I huffed harder on it, so the Fury 2 compensates pretty quickly to dropping temp during a draw.
- In my third draw it compensated three times during my draw.
- The last draw was started with 6 seconds on the timer, so it's essentially a cool down hit.
So, it looks to me like the Fury 2 operates a lot like
the Mighty, which in normal use is a full convection hit on the first draw followed by later hits that are mostly radiant and conduction heat with a slight boost from convection air. In the sit test the Mighty was slower to get to the highest temp, but it was a higher temp than the Fury was when sitting still. I think I'm going to find over time that this is the most common heat profile for all these hybrids.
And for shits and giggles I ran the session test (I'm starting to call these sit tests and session tests) with the glass wpa and got a pretty similar curve except for the extra hit.
One thing to note is the graphs aren't to identical scales. It changes based on how much data and whether or not I mess with it any. I try to keep them as similar as I can. For instance, this session had an extra hit in it, even though it was the same time frame as the previous one, so I pulled it out a bit so it wasn't getting compressed. If that's erroneous, let me know and I'll come up with a standard to apply to them all.


